Feeds:
Posts
Comments

Archive for the ‘MS Project General’ Category


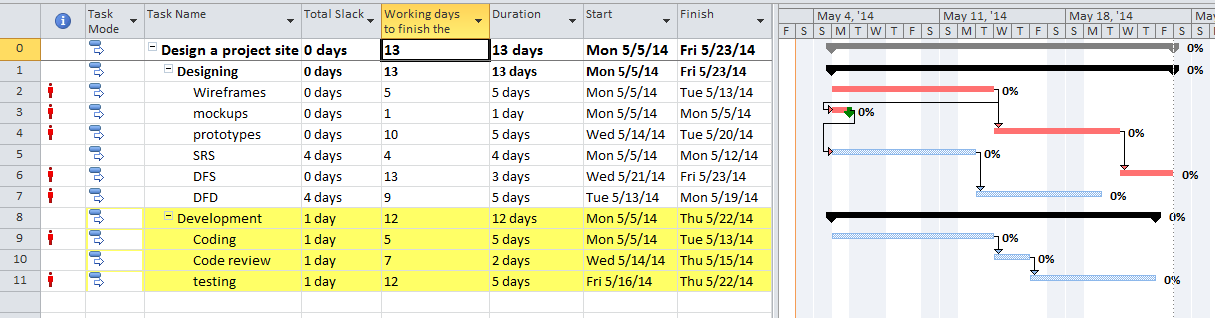
As we know, there are issues with having downloading project plans(local copy) from project pro and then re-synching them with server version, I won’t get into specific issues

In order to avoid this issue we had asked our users not use the the Save As command, but as you know guidelines almost never works 100% 😉

Hence we decided to block/Disable the Save As  functionality from Project Pro, what better way would it be other than a simple macro to prevent users to do a Save As

And so we wrote an event module, which overrides the Save As event and displays a message to user of this being disabled

Just for sake of completeness i have embedded my whole macro which ahs another function running for validating other ECF’s but not needed only to disable Save As

Step 1.  Check out Enterprise Global

Step 2.  Event and Class Module

Step 3. Save and checkin Ent Global

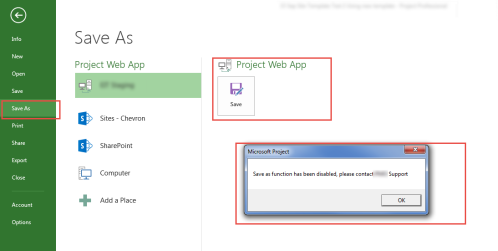
Note: Reopen project pro, connect to project server, open any project and then try to do Save As, see snapshots below

autoopenclassmodule

eventmodule


Save As Error.png

<Code>

Option Explicit
Option Base 1

Public WithEvents App As Application
Public WithEvents Proj As Project

Private Sub App_ProjectBeforeSave2(ByVal pj As Project, ByVal SaveAsUi As Boolean, ByVal Info As EventInfo)
Dim change As Integer
Dim msgRes As VbMsgBoxResult

If (App.Projects.Count > 0) Then
change = DetectInvalidEntries() ‘ this is a separate function to detect a specific Custom field value and allow user to save the project
If (change > 0) Then
msgRes = MsgBox(“For my Owner Org, Department should alwayss be India IT”, vbCritical, “Owner Org Change”)
‘Cancel the save
Info.Cancel = True
End If
End If

If (SaveAsUi) Then ‘Traps the SaveAsUi event and cancels the event
If ((InStr(UCase(App.UserName), “ADMIN”)) < 1) Then ‘ Check to Only allow Admin User to still use the functionality
MsgBox (“‘Save As’ function has been disabled, please contact Administrator”)
Info.Cancel = True
End If
End If
End Sub
Public Function DetectInvalidEntries() As Integer

Dim projectFieldDept, projectFieldPrjOwner As Long
Dim departmentsValue As String
Dim ProjOwnerOrg, scheduleDrivenCheck, multiDepartmentsCheck As Integer

‘Get the field values
projectFieldDept = FieldNameToFieldConstant(“Project Departments”, pjProject)
projectFieldPrjOwner = FieldNameToFieldConstant(“Owner Org”, pjProject)

‘See if the value changed
ProjOwnerOrg = InStr(ActiveProject.ProjectSummaryTask.GetField(projectFieldPrjOwner), “My Owner Org”)

‘load the Project Departments value
departmentsValue = ActiveProject.ProjectSummaryTask.GetField(projectFieldDept)
scheduleDrivenCheck = InStr(departmentsValue, “India IT”)
multiDepartmentsCheck = InStr(departmentsValue, “India IT,Manilla IT”)

‘Detect the change
If (ProjOwnerOrg > 0) Then
If (scheduleDrivenCheck > 0 Or multiDepartmentsCheck > 0) Then
DetectInvalidEntries = 1
End If
End If
End Function
‘—————Initiate the Event Class module for auto open——————–

Option Explicit

Dim x As New EventClassModule

Sub Auto_Open()
Set x.App = MSProject.Application
Set x.Proj = Application.ActiveProject
End Sub

</Code>


Read Full Post »


While working and extending a few macros recently, noticed i didn’t had access to database (same as in Project Online, well i could use Odata but again it cumbersome, so i went with my comfort zone VBA), and i needed to extract 15 project specific resources and thats where i started thinking should i do it manually, well easy enough if i only had 15 projects what if more than 100 and hence started writing macro, didn’t took longer may be 20 min and here is is

<code>

Sub GetAllRes()

‘Declare Object Variables for use

Dim xlApp As Excel.Application
Dim xlBook As Excel.Workbook
Dim xlSheet As Excel.Worksheet

‘Set Excel Application, Workbook, Worksheet reference to be used
Set xlApp = New Excel.Application
xlApp.Visible = True
Set xlBook = xlApp.Workbooks.Add
Set xlSheet = xlBook.Worksheets.Add
xlSheet.Name = “AllRes”
Set xlRow = xlApp.ActiveCell

Dim allProj()

‘ Well i could have read this from a file as well, just got lazy as there were only handful projects 😉
allProj = Array(“Prj1”, “Prj2”, “Prj3”, “Prj4”, “Prj5”, “Prj6”, “Prj7”, “Prj8”, “Prj9”)
Dim CurrArr
Dim Res As Resource
Dim Row As Integer
Row = 1

xlSheet.Rows.Cells(0, 0) = “ProjectName”
xlSheet.Rows.Cells(0, 1) = “ResourceName”
xlSheet.Rows.Cells(0, 2) = “Resource Type”

For Each CurrArr In allProj
PrjName = “<>\” + CurrArr
FileOpenEx Name:=PrjName, ReadOnly:=True
For Each Res In ActiveProject.Resources
‘MsgBox (Res.Name + “–” + CStr(Res.EnterpriseUniqueID))
xlSheet.Rows.Cells(Row, 1) = CurrArr
xlSheet.Rows.Cells(Row, 2) = Res.Name
If Res.EnterpriseUniqueID = -1 Then
xlSheet.Rows.Cells(Row, 2) = “Local”
Else
xlSheet.Rows.Cells(Row, 2) = “Enterprise”
End If
Next

Next

End Sub

</code>

Let me know what you think

Read Full Post »


Scenario : You have to track all those tasks which if delayed by 3 days (you can change the Total Slack value say 5 days) would fall on the ciritcal tasks path. So, these could be termed as the near critical tasks which need to be monitored closely along with the Critical path in the project to adhere to the commited timelines.

Total Slack is defined as : The amount of time a task’s finish could be delayed without delaying the Project’s finish date. Critical Tasks by default have 0 Total Slack.

Let’s create a view for these second level critical tasks, it could be done even directly in Gantt View itself, yet let’s create a view.

We want to define a view which :
•Displays the true Critical Path in the project using red Gantt bars for all tasks that have 0 days of Total Slack.
•Displays the “nearly Critical” Path for the tasks that have Total Slack less than 3 days.
•Highlight these tasks using in the table by background formatting.
•Display bars in the Gantt chart for these tasks in different color.

Create a Table named “Second level critical path.” You can either copy the current Entry table or create a new as needed.

Create a Filter “Second level critical path.” Give below parameters :
pic1

Create a View “Second Level Critical path.”
1. Table – Second level critical path
2. Group – No Group
3. Filter – Second level critical path
4. Select – Highlight Filter checkbox.

All ground work done for the view, once you apply this view you can see that all tasks with Total Slack less than 3 (but more than 0 to exclude critical tasks). Now when you apply this all near critical tasks get highlighted in the view.

pic2

Now we need to format the Gantt chart to display these tasks in different colored bars. Copied Total Slack into Number1 by using formula, then created Flag1 with formula as – IIf(([Number1]<3 And [Number1]0),1,0).

Now go to chart section -> right click -> bar styles give following values :
You can chose color from the below secction of the bars tab.

pic3

Now here comes an overall view where in the table we see tasks which have Total Slack less than 3days and can become critical if delayed beyond 3 days. In chart we can view Critical tasks, regular tasks and near critical tasks which if delayed beyond 3 days will fall on Critical path.

pic4

Read Full Post »


Scenario : I want to run a report to show that since the Start Date of the project how many working days would have elapsed until the finish date of a task. This is instrumental in projects with tight deadline wherein we try to assess that how many working days would fall before we really finish the tasks.
Create a text type task custom field and add the formula – ProjDateDiff([Project Start],[Finish])/480. This will give the exact working days from Project start date that goes into finish the task.

NOTE : In-case your work hours/day are different than Standard Calendar and you are using different project calendar, please add Calendar name as 3rd parameter in the formula within bracket and [Minutes per day] to divide instead of 480.

Project Start Date – 5/5 I have added 5/6-5/7 as the holiday.
pic2<

Refer to the task ID – 3 which starts on 5/5 (which is also project start date) and ends on 5/8 ( which shows that calculation has considered 5/5 and 5/8 as the working days count for calculations).

Highlighted are the tasks where the difference could easily be assessed.

pic1

Read Full Post »


Scenario : You want to assess the peak units (assignments) of various resources month-wise to better do the capacity planning, you can open your resource usage view – in that add Peak Units in the timephased area by right clicking and seleting it from list of the fields and then zoom in the timephased view to reach to month-wise details and here you have the peak unit assignments done on the resources month-wise. An excellent way to assess the current resource allocation to ensure that resourcing is done effectively.

pic1

Read Full Post »

Older Posts »